A PageSpeed Audit Skill, Tested on Our Own Site

Overview
Every site audit we run for clients starts the same way: open PageSpeed Insights, test mobile, test desktop, then copy scores, Core Web Vitals and the top opportunities into a document someone can act on. It’s slow, it’s manual, and the output is rarely in a shape a developer (or Claude Code) can pick up and fix directly.
So we built a PageSpeed audit skill, the first tool in a new seo-aeo-toolset plugin shared across our team. It pulls a full Google PageSpeed Insights (PSI) audit for any URL and writes a structured Markdown file that Claude Code can work through. Before we gave it to anyone else, we ran it on goosedigital.ai. This experiment covers how the skill works, what it found, and how far the scores moved.
Approach
The pipeline
Staff run /pagespeed-audit <url> <mobile|desktop> in Cowork, our internal AI workspace. The skill doesn’t call Google directly. It sends the request to an internal n8n webhook, which calls the PageSpeed Insights API and returns the raw results:
Staff (Cowork) → Skill script → n8n webhook → Google PageSpeed API → back to skill → .md audit file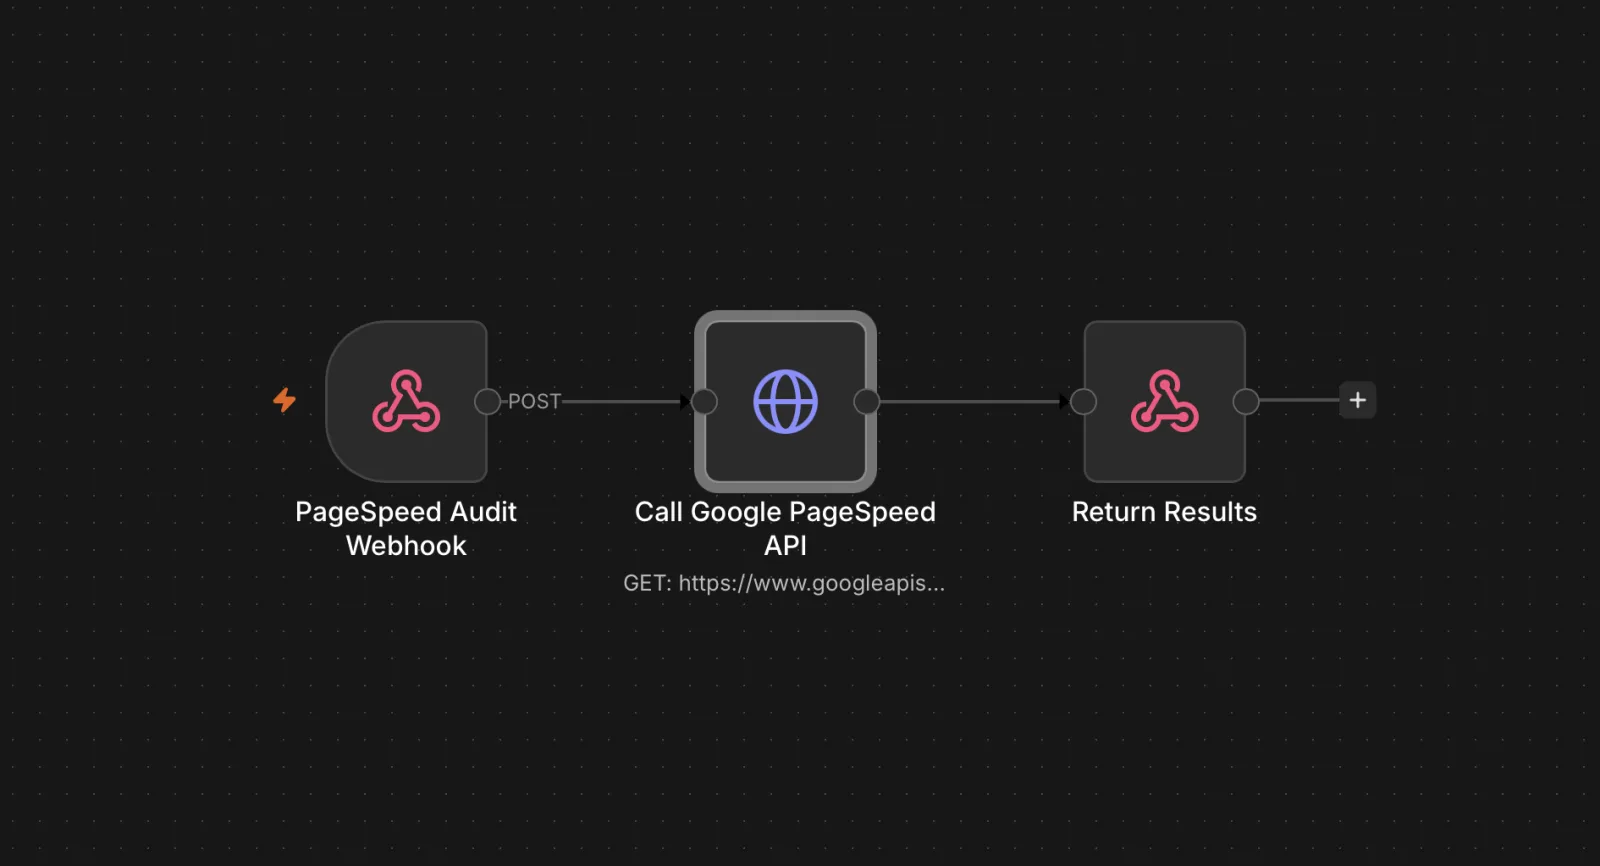
The workflow has just three nodes, and that’s on purpose. n8n is there to keep secrets safe, not to handle any audit logic:
- The Google API key lives only in n8n, stored as an encrypted credential. It’s never in the skill file, the plugin zip, or on anyone’s machine.
- The webhook needs a shared auth token, also stored as an n8n credential. Staff don’t need to set anything up: they install the plugin and it works.
- All the parsing happens in the skill. It pulls out category scores, Core Web Vitals (LCP, CLS, TBT, TTI), real-user field data when Google has it, and a list of fixes ranked by estimated load-time savings.
The workflow on our own site
We used the tool the way we expect our team to use it. First we ran the audit and handed the Markdown file to Claude Code. Then we fixed one group of issues at a time, deployed each group to Cloudflare Pages as its own pull request, and re-audited to confirm the change before starting the next group. Every finding had to show up again in a clean audit run before we treated it as real.
Results
Baseline vs. final
| Category | Mobile: Start → Final | Desktop: Start → Final |
|---|---|---|
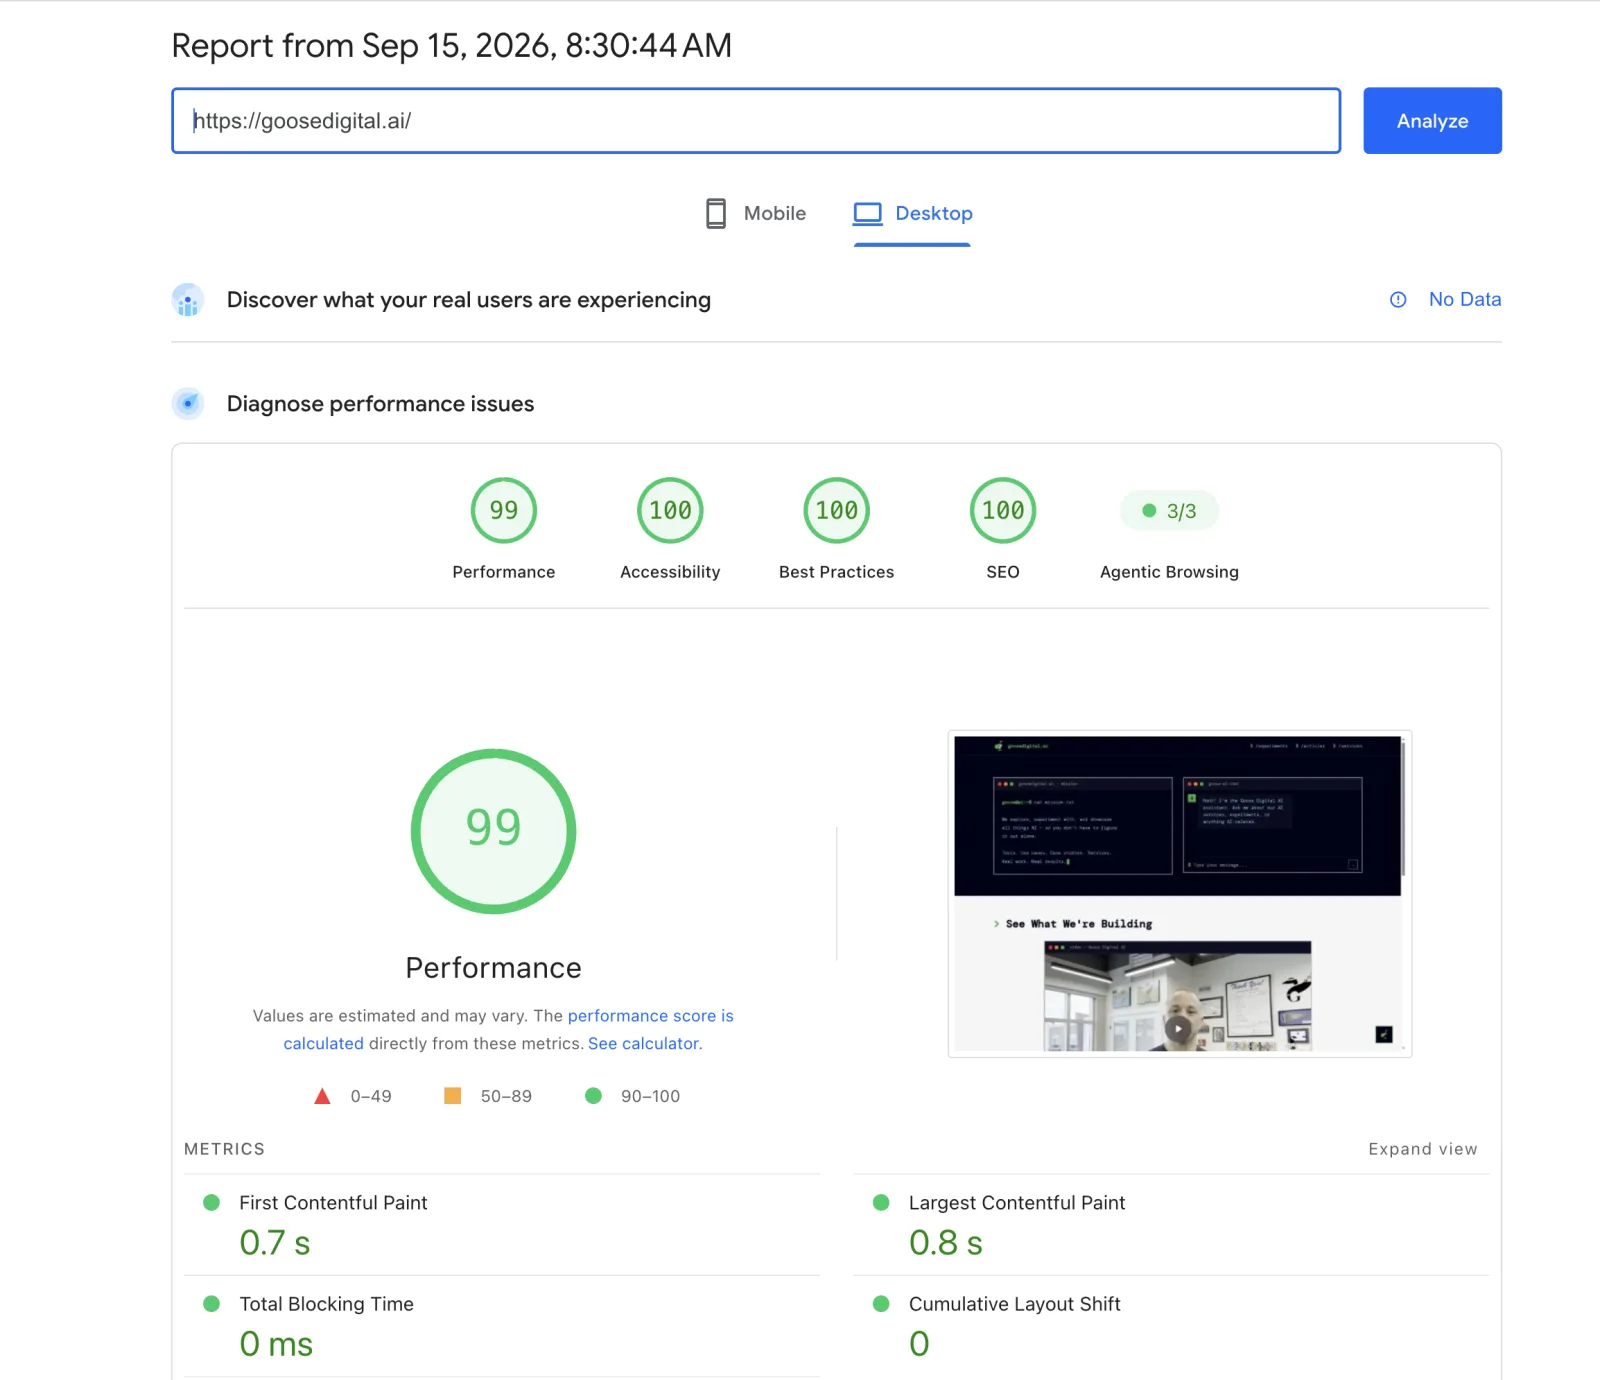
| Performance | 52 → 89 | 72 → 99 |
| Accessibility | 93 → 100 | 93 → 100 |
| Best Practices | 73 → 100 | 73 → 100 |
| SEO | 100 → 100 | 100 → 100 |
On mobile, Core Web Vitals improved sharply: LCP went from 7.2s to 3.0s, TBT from 470ms to 0ms, and TTI from 19.3s to 3.0s.
Wave 0: fixing the audit itself
Our first audit was wrong, and it took us a little while to notice. The n8n webhook was only requesting the best-practices category from the PSI API. That meant the first run couldn’t see Performance, Accessibility, SEO or Core Web Vitals at all, yet the report still looked complete. We fixed the webhook config to request every category before trusting any findings.
That early run also flagged “bloated fonts.” When we checked the finding against a clean audit, it turned out to be stale, so we dropped it rather than fixing something that wasn’t broken.
Wave 1: performance
Two changes caused almost all of the performance gain:
- A click-to-play facade on the Synthesia video embed. The homepage video was loading about 700KB of JavaScript as soon as the page opened, before anyone pressed play. We replaced it with a lightweight placeholder that loads the player on click, then added a poster image so the placeholder shows a real frame instead of an empty box.
- Non-blocking Google Fonts. The fonts stylesheet was delaying the first render. Preloading it and applying it once it arrives (with
font-display: swap) let the page render right away.
Together, these took mobile Performance from 52 to 89 and desktop from 72 to 99.
Wave 2: accessibility and best practices
The remaining issues were small, the kind that are easy to miss in code review:
- The chat launcher button was a
<div>. We changed it to a real<button>so it works with a keyboard and screen readers. - The footer headings skipped a level. We changed them from
h4toh3so the page outline reads in order. - The logo’s
aria-labeldidn’t match its visible text. We aligned the two so screen readers announce what users see. - The Cloudflare Turnstile widget used a deprecated setting (
size: "invisible"), which caused a browser warning. We replaced it with the current configuration.
Wave 3: the intermittent CSP error
Best Practices kept dropping back below 100 on some runs and not others. The cause was the Cloudflare Web Analytics beacon script: our Content Security Policy’s script-src rule was blocking it, which threw a console error, and Lighthouse lowers the Best Practices score for console errors. Because the beacon doesn’t load on every request, the problem came and went. Adding the missing domain to the CSP fixed it, and later audits have come back clean.
Lessons Learned
-
Check the audit before you trust it. Our first report looked complete but was missing most categories, and it included at least one stale finding. With AI-assisted tooling, the risk isn’t an obvious failure. It’s a polished report built on bad data. Now we check which categories came back before we look at the scores.
-
Keep secrets out of the skill. Routing the call through n8n means an internal skill can be shared across the company and still hold no credentials. It’s more work than pasting an API key into a script, but it’s the only option that holds up once more than one person installs it.
-
Heavy embeds are usually the biggest performance problem. One third-party video player accounted for most of our mobile performance loss. A click-to-play placeholder is a small change with a large effect, and it’s the first thing we’ll check on client sites.
-
Fix in small batches and re-audit after each one. Deploying one group of fixes at a time showed us exactly what moved each score. It’s also how we caught the intermittent CSP error, which would have been almost impossible to trace if we’d shipped everything at once.
-
Getting to 100 is mostly small fixes. Once the big performance issue was gone, the last few points came from a
<div>that should have been a button, a skipped heading level, a mismatched label and one missing CSP domain. None of them took long to fix, but you only find them if you run the audit.